Failing to record audio with a Tildagon ESP32
The Tildagon ESP32 badge contains an inertial measurement unit which can measure acceleration. Since sound waves will move everything (at least a little bit) can we use this accelerometer to record audio?
No, but we can learn its limits
Caveats
* All this code was written by ChatGPT (specifically o1-preview-2024-09-12) with manual supervision. - This code is not optimised for speed or correctness, so it could be possible to record audio, just unlikely.Recording the data
These scripts can be run on a connected tildagon by using mpremote
You would then run these using mpremote run WHATEVER-SCRIPT-SAVED-AS.py
Nice version with logging to see what's happening
```python import time import imu # Configuration parameters DURATION = 10 # Recording duration in seconds SAMPLE_RATE = 100000 # Samples per second (Hz) BUFFER_SIZE = 100 # Number of samples to buffer before writing to disk FILE_NAME = 'accelerometer_audio.txt' # Output file name def record_accelerometer(duration, sample_rate, file_name): sample_interval = 1000000 // sample_rate # Sample interval in microseconds data_buffer = [] sample_count = 0 # Initialize sample counter previous_time = None # To store the timestamp of the previous sample with open(file_name, 'w') as f: start_time = time.ticks_us() end_time = start_time + duration * 1000000 # Convert duration to microseconds next_sample_time = start_time print('Starting accelerometer recording...') while time.ticks_diff(time.ticks_us(), end_time) < 0: current_time = time.ticks_us() # if time.ticks_diff(current_time, next_sample_time) >= 0: if True: # Read accelerometer data x, y, z = imu.acc_read() sample_count += 1 # Increment sample counter # Calculate delta time between samples if previous_time is not None: delta_time = time.ticks_diff(current_time, previous_time) else: delta_time = 0 # For the first sample previous_time = current_time # Update previous_time # Append data to buffer with timestamp data_line = '{},{},{},{}\n'.format(current_time, x, y, z) data_buffer.append(data_line) # Logging: Print the sample number, delta time, and data # print('Sample {}: Δt={}us, Time={}, x={:.3f}, y={:.3f}, z={:.3f}'.format( # sample_count, delta_time, current_time, x, y, z)) # Schedule next sample time next_sample_time += sample_interval # If buffer is full, write to file if len(data_buffer) >= BUFFER_SIZE: for line in data_buffer: f.write(line) data_buffer = [] # else: # # Sleep briefly to yield control # time.sleep_ms(1) # Write any remaining data if data_buffer: for line in data_buffer: f.write(line) print('Recording complete. Total samples recorded: {}'.format(sample_count)) # Start recording record_accelerometer(DURATION, SAMPLE_RATE, FILE_NAME) ```Faster version with no nice logging
```python import time import imu # Configuration parameters DURATION = 10 # Recording duration in seconds BUFFER_SIZE = 5000 # Number of samples to buffer before writing to disk FILE_NAME = 'accelerometer_audio.txt' # Output file name def record_accelerometer(duration, file_name): sample_count = 0 # Initialize sample counter # Open the file in binary mode to speed up writing with open(file_name, 'wb') as f: start_time = time.ticks_us() end_time = start_time + duration * 1_000_000 # Convert duration to microseconds # Pre-allocate the buffer data_buffer = [''] * BUFFER_SIZE while time.ticks_diff(time.ticks_us(), end_time) < 0: current_time = time.ticks_us() # Read accelerometer data x, y, z = imu.acc_read() sample_count += 1 # Increment sample counter # Prepare data line data_line = '{},{},{},{}\n'.format(current_time, x, y, z) index = (sample_count - 1) % BUFFER_SIZE data_buffer[index] = data_line # If buffer is full, write to file if index == BUFFER_SIZE - 1: f.write(''.join(data_buffer).encode('utf-8')) # Write any remaining data remaining_samples = sample_count % BUFFER_SIZE if remaining_samples > 0: f.write(''.join(data_buffer[:remaining_samples]).encode('utf-8')) print('Recording complete. Total samples recorded:', sample_count) # Start recording record_accelerometer(DURATION, FILE_NAME) ```The data will be saved as accelerometer_audio.txt on the root of the device.
Recovering the data
The following command will copy the recorded data off the device to your current working directory
mpremote cp :accelerometer_audio.txt .
Analysing the data
If you use the script below, it’ll convert the raw acceleration data in to velocity and attempt to use that as an audio signal. It’ll write this out as output_audio.wav which you can then listen to, and admire the thumps.
Analysis script which displays amplitude and frequency data
To use this, first install some modules using `pip3 install numpy scipy matplotlib` Then run the script from the directory where you downloaded the `accelerometer_audio.txt` file. ```python import numpy as np from scipy.io import wavfile import matplotlib.pyplot as plt from scipy.interpolate import interp1d def accelerometer_to_sound_with_integration(file_name, output_wav='output_audio.wav'): # Read accelerometer data from file timestamps = [] x_values = [] y_values = [] z_values = [] with open(file_name, 'r') as f: for line in f: # Each line is formatted as: timestamp,x,y,z parts = line.strip().split(',') if len(parts) == 4: timestamp_str, x_str, y_str, z_str = parts try: timestamp = int(timestamp_str) x = float(x_str) y = float(y_str) z = float(z_str) timestamps.append(timestamp) x_values.append(x) y_values.append(y) z_values.append(z) except ValueError: # Handle lines with invalid data continue # Convert lists to numpy arrays timestamps = np.array(timestamps) x_values = np.array(x_values) y_values = np.array(y_values) z_values = np.array(z_values) # Convert timestamps from microseconds to seconds timestamps = (timestamps - timestamps[0]) / 1e6 # Start from zero # Calculate the total duration and actual sampling rate total_duration = timestamps[-1] - timestamps[0] num_samples = len(timestamps) actual_sample_rate = num_samples / total_duration if total_duration > 0 else 1 # Samples per second print(f"Total duration: {total_duration:.3f} seconds") print(f"Number of samples: {num_samples}") print(f"Actual average sample rate: {actual_sample_rate:.2f} Hz") # Subtract the mean (DC offset) from each axis to remove gravity x_mean = np.mean(x_values) y_mean = np.mean(y_values) z_mean = np.mean(z_values) x_values_zeroed = x_values - x_mean y_values_zeroed = y_values - y_mean z_values_zeroed = z_values - z_mean # Compute the magnitude of the acceleration vector at each time point acceleration_magnitude = np.sqrt(x_values_zeroed**2 + y_values_zeroed**2 + z_values_zeroed**2) # Remove any residual DC offset from acceleration magnitude acceleration_magnitude -= np.mean(acceleration_magnitude) # Create an interpolation function to resample the acceleration at a uniform rate target_sample_rate = int(actual_sample_rate) # Create new time vector with uniform sampling uniform_timestamps = np.linspace(timestamps[0], timestamps[-1], int(total_duration * target_sample_rate)) # Interpolate the acceleration onto the uniform time grid interpolation_function = interp1d(timestamps, acceleration_magnitude, kind='linear', fill_value='extrapolate') resampled_acceleration = interpolation_function(uniform_timestamps) # Integrate acceleration to obtain velocity # Use cumulative trapezoidal integration from scipy.integrate import cumulative_trapezoid velocity = cumulative_trapezoid(resampled_acceleration, uniform_timestamps, initial=0) # Remove any linear trend (drift) from the velocity signal from scipy.signal import detrend velocity_detrended = detrend(velocity) # Optional: Apply a high-pass filter to remove low-frequency noise from scipy.signal import butter, filtfilt def highpass_filter(data, cutoff=20, fs=target_sample_rate, order=5): nyq = 0.5 * fs # Nyquist Frequency normal_cutoff = cutoff / nyq # Get the filter coefficients b, a = butter(order, normal_cutoff, btype='high', analog=False) y = filtfilt(b, a, data) return y # Apply high-pass filter to remove frequencies below 20 Hz filtered_signal = highpass_filter(velocity_detrended, cutoff=20) # Normalize the signal to the int16 range (-32768 to 32767) max_abs_value = np.max(np.abs(filtered_signal)) if max_abs_value == 0: max_abs_value = 1 # Prevent division by zero normalized_signal = filtered_signal / max_abs_value # Now between -1 and 1 audio_signal = np.int16(normalized_signal * 32767) # Save the audio signal as a WAV file wavfile.write(output_wav, target_sample_rate, audio_signal) print(f"Audio file '{output_wav}' has been created with duration {total_duration:.3f} seconds.") # Plot the time-domain signal plt.figure(figsize=(12, 4)) plt.plot(uniform_timestamps, normalized_signal) plt.title('Normalized Velocity Signal (Integrated from Acceleration)') plt.xlabel('Time (s)') plt.ylabel('Amplitude') plt.show() # Compute the FFT of the signal fft_result = np.fft.fft(filtered_signal) fft_freqs = np.fft.fftfreq(len(filtered_signal), d=1.0 / target_sample_rate) # Only keep the positive frequencies positive_freqs = fft_freqs[:len(fft_freqs)//2] positive_magnitudes = np.abs(fft_result[:len(fft_result)//2]) # Plot the frequency spectrum plt.figure(figsize=(12, 6)) plt.plot(positive_freqs, positive_magnitudes) plt.title('Frequency Spectrum of the Velocity Signal') plt.xlabel('Frequency (Hz)') plt.ylabel('Magnitude') plt.xlim(0, target_sample_rate / 2) # Limit x-axis to Nyquist frequency plt.grid(True) plt.show() # Optionally, plot the spectrum on a logarithmic scale plt.figure(figsize=(12, 6)) plt.semilogy(positive_freqs, positive_magnitudes) plt.title('Frequency Spectrum of the Velocity Signal (Log Scale)') plt.xlabel('Frequency (Hz)') plt.ylabel('Magnitude (Log Scale)') plt.xlim(0, target_sample_rate / 2) plt.grid(True, which='both', linestyle='-', color='grey') plt.show() # Example usage accelerometer_to_sound_with_integration('accelerometer_audio.txt', output_wav='output_audio.wav') ```What does the analysed data mean
If you firmly tapped on the device during recording, you should be able to hear those taps, in a weird low quality audio recording way.
Normalized Velocity Signal
You should be able to see any movement/firm bumps you gave to the device during recording here. The size of the bump should correspond to how “loud” the sound is at that part of the recording.
Frequency Spectrum of the Velocity Signal
This is showing the frequencies present in the audio signal, for this test there’s a peak at ~ 30Hz, with various other peaks which reduce rapidly above 50Hz.
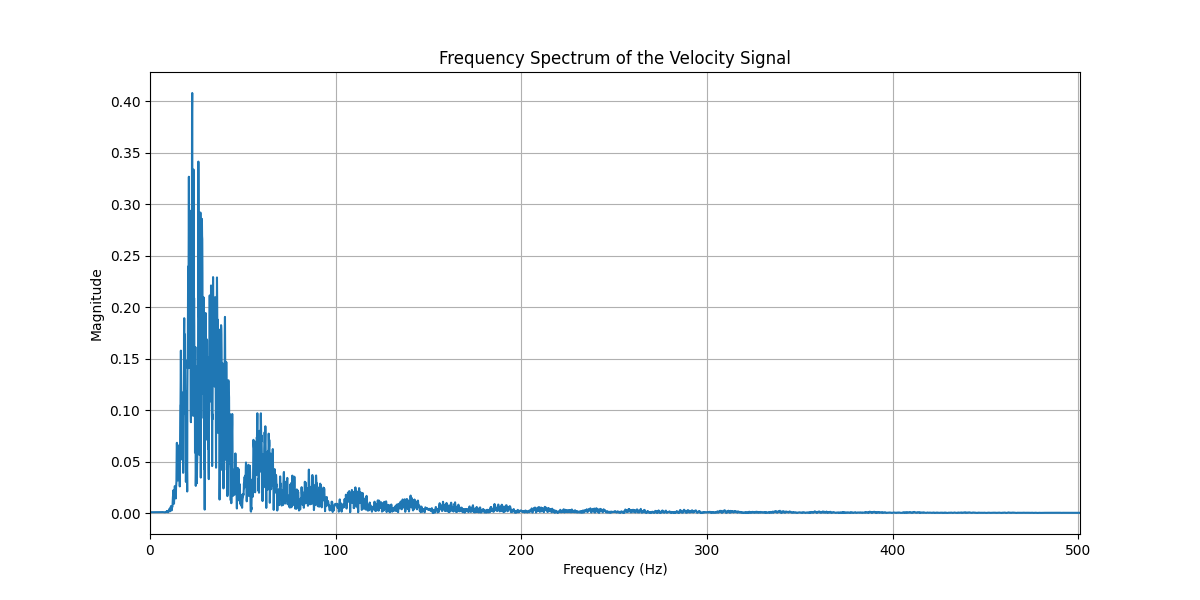
I interpret this as the accelerometer (and my recording script) having a decreasing sensitivity as the frequency increases, and almost no sensitivity above 100Hz.
Given human speech typically falls in the range 90 - 255Hz this “recorder” won’t be able to capture speech.
This is further confirmed by the fact the device itself supports a maximum accelerometer polling rate of 1.6kHz, this means the maximum audio frequency we could record would be 800Hz.
Conclusions
The low sampling rate (~ 1kHz) and low sensitivity to typical speech frequencies mean this isn’t a practical device to use as microphone. This still could have some uses, such as recording the frequency of dancers jumping at the club Null Sector to compare this to the tempo of the songs being played from worn Tildagons.